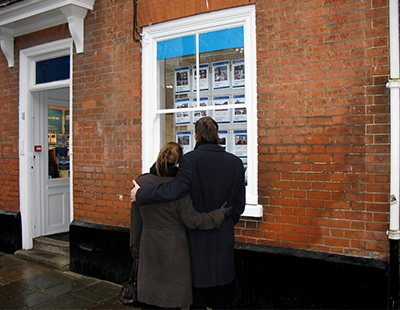
The number of movers has declined by around 50 per cent since the halcyon days of 2006, before the global financial crisis.
Research by the Yorkshire Building Society suggests that 367,800 home-owners moved house with mortgages in 2018, down 48 per cent from the 712,100 recorded in 2006.
Analysing UK Finance figures, the society says that in 2017 there were 374,800 mortgages approved for people moving house - the highest number since 2006. The 2018 figures therefore represent a minor one per cent drop on the previous year and are almost a fifth higher than 2009, when there were just 315,000 home-movers taking out mortgages.
However, the figures don’t include cash buyers – those who buy without a mortgage - who now represent an estimated third of all house purchases, says the society.
Nitesh Patel, the society’s chief economist, says: “While this might indicate fewer people are moving than before the financial crisis, we are also seeing more people are buying homes with cash … This could mean we are seeing a rise in older home-owners downsizing by moving to a smaller and less expensive property. More people now own their own home outright than with a mortgage.
“Also, since 2014, there’s been little change in the number of home-movers buying a home with a mortgage. This indicates the home-mover market has stalled over the past four years.”
Patel adds that the supply of homes from existing housing stock coming on the market has been falling since the financial crisis, making it difficult for current home owners to move on. “Since 2016, supply has been at an all-time low, and less than half of what it was pre-crisis.”
The annual home mover figures from Yorkshire Building Society/UK Finance are below:
|
Year
|
Number of home movers
|
Year-on-year change
|
Proportion of all mortgage-financed house sales
|
|
2006
|
712,100
|
16%
|
64%
|
|
2007
|
653,700
|
-8%
|
64%
|
|
2008
|
320,600
|
-51%
|
63%
|
|
2009
|
315,000
|
-2%
|
62%
|
|
2010
|
340,000
|
8%
|
63%
|
|
2011
|
315,800
|
-7%
|
62%
|
|
2012
|
326,400
|
3%
|
60%
|
|
2013
|
338,000
|
4%
|
56%
|
|
2014
|
363,400
|
8%
|
54%
|
|
2015
|
363,200
|
0%
|
54%
|
|
2016
|
358,900
|
-1%
|
52%
|
|
2017
|
374,800
|
4%
|
51%
|
|
2018
|
367,800
|
-1%
|
50%
|


Join the conversation
Be the first to comment (please use the comment box below)
Please login to comment