The cities of Liverpool, Nottingham and Manchester have enjoyed the biggest house price rises since pre-Covid.
Despite interest rates at a 13-year high and a fairly flat current market, cities have enjoyed healthy price rises since January 2020.
New research by Zoom Property Buyer reveals the biggest increases in a league table of UK cities….and London is bottom of the pile.
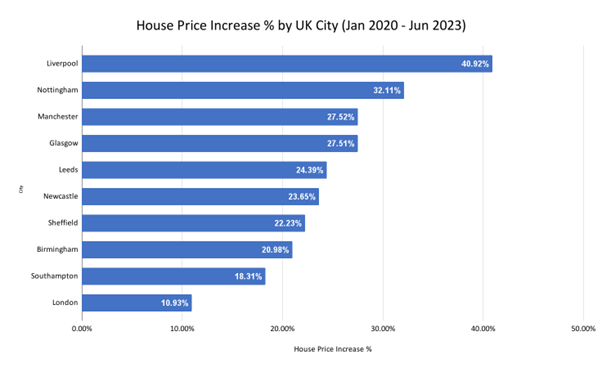
House Price Increases in the UK’s Top 10 Biggest Cities from January 2020 to June 2023
- Liverpool: 40.92%
- Nottingham: 32.11%
- Manchester: 27.52%
- Glasgow: 27.51%
- Leeds: 24.39%
- Newcastle upon Tyne: 23.65%
- Sheffield: 22.23%
- Birmingham: 20.98%
- Southampton: 18.31%
- London: 10.93%
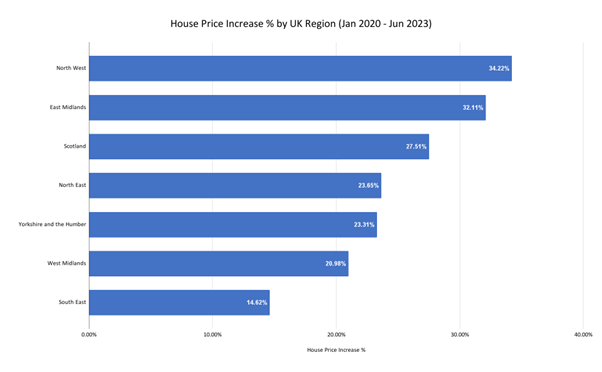
Across the UK, some surprising results emerged.
Despite the reputation of the South for expense, it was the North West region that saw the largest hikes in house prices.
- North West 34.22%
- East Midlands 32.11%
- Scotland 27.51%
- North East 23.65%
- Yorkshire and the Humber 23.31%
- West Midlands 20.98%
- South East 14.62%
"These findings provide a comprehensive view of the UK property market, highlighting the diverse growth patterns across cities and regions," said Zoom Property Buyer’s Mark Hardman.
“It’s unclear how these trends will continue in the wake of instability in the property market,” he added, “but the impact of the post-pandemic economy has seen increases of up to a third in some parts of the country.”
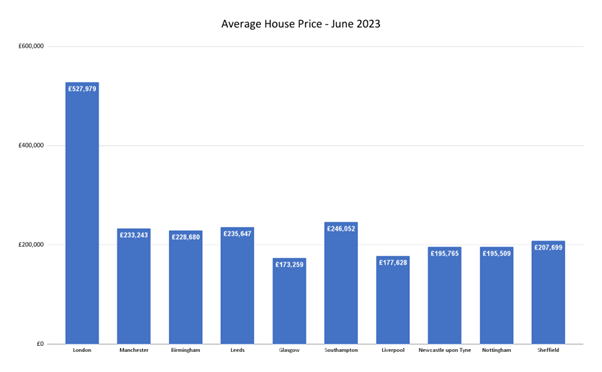
The findings also underscore a prominent North/South divide in the UK property market - but not as you might expect.
While cities in the North such as Liverpool and Manchester have seen the most significant growth, London still remains the most expensive, with average house prices reaching over £500,000.
Methodology Based on a review of average house prices in each city month-on-month between January 2020 and June 2023. Data from HM Land Registry.


Join the conversation
Please login to comment