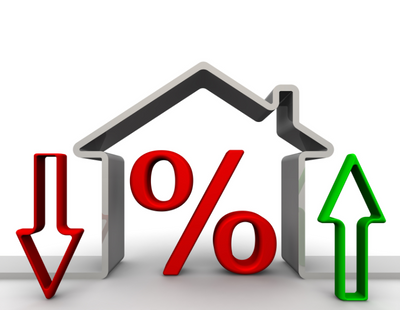
The average discount to asking price on a sold property has almost doubled since last July as sellers are becoming ‘more realistic,’ research suggests.
New data on prime London properties from LonRes shows the average discount to asking price has increased, from 4.7% in July last year to 8.4% in February.
That is still below the 12.8% discount reached during the financial crisis in 2019.
The need for realistic pricing is further highlighted by the average discount to asking price in prime London depending on how long it took for the property to sell, according to LonRes.
On average, the longer it takes to sell the bigger the discount to asking price is required, the research suggests.
In September last year, the average discount to asking price for homes selling in under three months was just 1.7% while the discount for homes taking between six and twelve months was 7.3%.
The current discount for homes selling in under three months is now 3.5% while the discount for those selling in six to twelve months is now 9.6%
The research showed that prime London sales were 9.1% below their pre-pandemic average last month but under offers were 10.5% higher.
Prime London house prices have also fallen 2.8% over the past 12 months and are just 1.7% above their pre-pandemic levels.
Anthony Payne, managing director of LonRes, said: “We’re continuing to see a rise in new instructions coming to the market. In February they were 14% up on the same month last year and 23.6% higher than before the pandemic.
“This means there is more choice for buyers. And while there appears to be no let up in buyers looking to purchase, there also seems to be no urgency in them committing to a sale. For serious sellers out there, asking prices need to reflect the mood-change in the market.”
|
|
Prime Sales
|
Prime Lettings
|
|
Annual
Change
|
Change Since 2017-19 (pre-pandemic)
|
Annual
Change
|
Change Since 2017-19 (pre-pandemic)
|
|
Achieved prices/ rents
|
-2.8%
|
1.7%
|
8.4%
|
19.0%
|
|
Properties sold/let
|
-32.9%
|
-9.1%
|
-29.5%
|
-59.4%
|
|
New instructions
|
14.0%
|
23.6%
|
-4.5%
|
-48.7%
|





.jpg)
.jpg)




.png)


Join the conversation
Be the first to comment (please use the comment box below)
Please login to comment