A new analysis has revealed those areas of England and Wales with the largest numbers of Russian-owned homes.
Credas Technologies analysed Land Registry titles registered to individuals with overseas addresses located within the Russian Federation, and estimating the current worth of this Russian property portfolio based on current market values.
The research shows that there are a total of 1,127 Russian owned homes across England and Wales, sitting at a total value of £499.1m - almost exactly half a billion pounds.
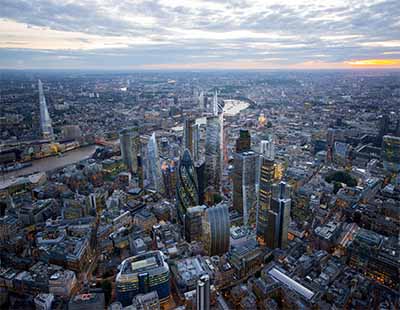
The City of Westminster is the Russian property market hotspot with some 87 and then - perhaps surprisingly - Liverpool is next with 72 properties registered to addresses within the Russian Federation.
The council areas of Tandridge in Surrey (57), Newham (54), Lambeth (44), Bradford (39), Tower Hamlets (34), Blackpool (32), Kensington and Chelsea (30) and Southwark (29) also rank in the top 10.
Less surprising, Westminster is where the highest market value of Russian owned homes is concerned, with Credas estimating that the 87 properties registered within the Russian Federation hold a combined worth of £89.7m.
While Kensington and Chelsea may only be home to 30 Russian owned homes, the high cost of homeownership means the borough is home to the second largest combined value of Russian properties at £41.2m.
Tandridge in Surrey ranks third at £29.3m followed by Lambeth (£24m), Newham (£21.6m), Hammersmith and Fulham (£16.5m), Southwark (£16m), Camden (£15.6m) and Tower Hamlets and Wandsworth (each £15m).
There are 138 homes across England and Wales with titles registered to Ukrainian addresses totalling £54.7m in value, with Newham in east London home to the largest number, 20.
Tim Barnett, CEO of Credas Technologies says: “It’s important to note that there are likely to be many pockets of Russian bricks and mortar that have been purchased through business entities and that won't have been registered within this data.
“Regardless of how they’ve been obtained, the uncertain outlook currently facing the Russian economy could spur them to become full-time places of residency for the foreseeable future, at least.”
|
Table shows the top 20 areas for Land Registry titles registered to individuals with an overseas correspondence address in the Russian Federation, the current average property value in each area and the total estimated value of Russian owned homes
|
|
Location
|
Russian registered titles
|
Average house price
|
Total Estimated property value
|
|
City of Westminster
|
87
|
£1,031,431
|
£89,734,537
|
|
Liverpool
|
72
|
£164,867
|
£11,870,417
|
|
Tandridge
|
57
|
£514,009
|
£29,298,491
|
|
Newham
|
54
|
£399,569
|
£21,576,740
|
|
Lambeth
|
44
|
£547,370
|
£24,084,290
|
|
Bradford
|
39
|
£160,969
|
£6,277,792
|
|
Tower Hamlets
|
34
|
£442,028
|
£15,028,960
|
|
Blackpool
|
32
|
£130,372
|
£4,171,916
|
|
Kensington and Chelsea
|
30
|
£1,374,008
|
£41,220,245
|
|
Southwark
|
29
|
£553,470
|
£16,050,638
|
|
Birmingham
|
27
|
£213,158
|
£5,755,278
|
|
Wandsworth
|
24
|
£626,064
|
£15,025,535
|
|
Rochdale
|
24
|
£173,735
|
£4,169,639
|
|
Cornwall
|
22
|
£298,660
|
£6,570,515
|
|
Hambleton
|
22
|
£272,521
|
£5,995,461
|
|
Sheffield
|
21
|
£197,135
|
£4,139,831
|
|
Sefton
|
21
|
£197,303
|
£4,143,364
|
|
North Hertfordshire
|
20
|
£374,137
|
£7,482,739
|
|
Hammersmith and Fulham
|
20
|
£825,487
|
£16,509,740
|
|
Barnet
|
20
|
£578,382
|
£11,567,636
|
|
England and Wales
|
1,127
|
N/A
|
£499,142,331
|
|
Table shows the top 20 areas for Land Registry titles registered to individuals with an overseas correspondence address in the Ukraine, the current average property value in each area and the total estimated value of Russian owned homes
|
|
Location
|
Ukrainian registered titles
|
Average house price
|
Total Estimated property value
|
|
Newham
|
20
|
£399,569
|
£7,991,385
|
|
Liverpool
|
14
|
£164,867
|
£2,308,137
|
|
Salford
|
9
|
£199,859
|
£1,798,729
|
|
Hambleton
|
7
|
£272,521
|
£1,907,647
|
|
City of Westminster
|
7
|
£1,031,431
|
£7,220,020
|
|
Sheffield
|
6
|
£197,135
|
£1,182,809
|
|
Isle of Wight
|
5
|
£269,778
|
£1,348,889
|
|
Southwark
|
5
|
£553,470
|
£2,767,351
|
|
Hammersmith and Fulham
|
3
|
£825,487
|
£2,476,461
|
|
Lambeth
|
3
|
£547,370
|
£1,642,111
|
|
Manchester
|
3
|
£211,873
|
£635,618
|
|
Horsham
|
3
|
£428,541
|
£1,285,622
|
|
Tower Hamlets
|
3
|
£442,028
|
£1,326,085
|
|
City of Nottingham
|
3
|
£173,032
|
£519,096
|
|
Sevenoaks
|
3
|
£505,238
|
£1,515,713
|
|
Waltham Forest
|
2
|
£484,621
|
£969,242
|
|
Sunderland
|
2
|
£137,419
|
£274,839
|
|
Tandridge
|
2
|
£514,009
|
£1,028,017
|
|
Wandsworth
|
2
|
£626,064
|
£1,252,128
|
|
Kirklees
|
2
|
£177,532
|
£355,064
|
|
England and Wales
|
88
|
N/A
|
£40,736,967
|


/BorisJohnson-BlackandWhite-400x310.jpg)


Join the conversation
Be the first to comment (please use the comment box below)
Please login to comment